Create the best graph

Task types:
Locations:
Task brief
The brief for the task is as follows:
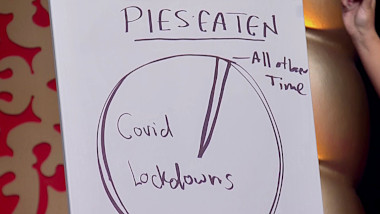
Create the best graph.
You have 20 minutes.
Your time starts now.
Task notes
It looks like there are no notes yet for this task. Someone's probably working on it, though!
Task video
Task stats
Points
18
Disquals
0
Attempts
Here's a brief description of the contestants' attempts. Someone's probably working on writing up some additional detail, though!
- Aisling made a graph to show how many men and were had been featured on Taskmaster since Series 1, although her numbers were not correct.
- Bob made a graph showing the amount of urine produced in various locations of the UK.
- Mark made a graph to show how many people had voted throughout human history.
- Nish stood on a rake, using himself as a y-axis, to show that the more time spent with Nish, the more fun.
- Sally made a line graph showing how much sex she was having, and how much sex she wanted, over time.
(Source credit: Taskmaster Wiki contributors)


Similar tasks


Show:
Season:
Date:
29/09/2018